CRM reporting: the 5 metrics that actually predict revenue
Your CRM has a reporting tab. You've probably clicked it once, stared at a wall of charts you didn't build, and quietly closed it. That's not unusual — most CRM dashboards ship loaded with activity metrics that look busy but don't predict anything. Calls logged. Emails sent. Contacts added. None of it tells you whether you'll hit your number this month. The CRM reporting metrics that actually predict revenue are a much shorter list — five numbers — and most small businesses aren't tracking any of them. Five numbers. Fifteen minutes a week. That's the gap between a CRM that predicts revenue and one that just stores contacts.
Your CRM has 50 reports and none of them help
Default CRM dashboards are built to impress during the sales demo, not to help you run your business. They're packed with colorful charts showing email open rates, call volume, and task completion — activity metrics that feel productive but don't correlate with closed deals.
Here's the problem with activity metrics: they measure effort, not outcomes. A rep who made 40 calls this week looks great on the dashboard. But if none of those calls moved a deal forward, those 40 calls added zero revenue.
Meanwhile, another rep made 8 calls and closed two deals. The activity dashboard says rep one is outperforming. Your bank account disagrees.
It gets worse when those reports drive behavior. If the dashboard rewards call volume, reps make more calls — but shorter, lower-quality ones. You get exactly what you measure, so measure the right things.
This isn't a minor distinction. According to SaleSso's quota attainment research, only about 24% of salespeople exceed their yearly quota. Teams that obsess over activity dashboards instead of outcome metrics are a big part of that gap — they're measuring the wrong things, so they optimize for the wrong behavior.
The fix isn't buying a fancier analytics tool or building more reports. It's the opposite. Strip your dashboard down to five numbers that actually predict whether revenue is going up or down. Everything else is decoration.
Win rate tells you if your sales process works
Win rate is the simplest CRM reporting metric on this list and the one most small teams ignore. It's the percentage of opportunities you close. Twenty deals in your pipeline this quarter, five closed — that's a 25% win rate.
Simple as it sounds, this number tells you more about your business than any activity report ever will. According to LeadIQ's pipeline benchmarks, typical B2B small business win rates land between 20% and 30%.
Below 20% means you've got a qualification problem — you're letting bad-fit deals into your pipeline and spending time on prospects who were never going to buy. Above 40% and you might not have enough pipeline — you're only pursuing sure things and leaving growth on the table.
Win rate also exposes whether your pipeline stages are honest. If 30 deals sit in "Proposal Sent" but only 2 closed last quarter, your pipeline isn't healthy. It's bloated with stalled opportunities that should've been disqualified weeks ago.
Track this monthly. A win rate that drops from 28% to 18% over two months is an early warning. Maybe your messaging changed. Maybe a competitor launched something new. Whatever caused it, you want to catch it in month two — not month six.
One more thing: measure win rate against qualified opportunities, not every contact in your CRM. If you include everyone who filled out a form, your rate will look artificially low and you'll chase a problem that doesn't exist.
Pipeline coverage answers "will I hit my number?"
Pipeline coverage is your early warning system for revenue misses. It answers one question: do you have enough deals in play to hit your target?
The math is straightforward. Divide total pipeline value by your revenue target for the period. If you need to close $50,000 this quarter and you've got $150,000 in pipeline, your coverage ratio is 3:1.
According to LeadsterHub's pipeline metrics guide, 3:1 is the minimum healthy coverage for most sales teams. If your win rate is lower — say 15–20% — you need 4:1 or even 5:1 to hit your number reliably.
Below 2.5:1 is a red flag. It means even if you close at a better rate than usual, you're probably going to fall short. The time to fix a coverage gap is this month, not next month. By the time you notice, it's too late to build pipeline for the current quarter.
Here's where most small businesses get it wrong: they count total pipeline value without checking what's actually alive in there. If half your pipeline is deals sitting in "Proposal Sent" for three months with no response, they shouldn't count. That's not coverage — it's wishful thinking.
Only include deals that are actively moving. If your CRM data is messy, this number will lie to you.
Most teams we talk to have never calculated this ratio. They know what's in their pipeline — or think they do — but they've never compared it to a target. Once they do, the reaction is usually "oh, that's why last quarter felt so tight." The number changes behavior fast.
Check coverage at the start of every month. If it's below 3:1, shift your focus to pipeline generation immediately — not at the end of the quarter when the gap is already baked in.
Pipeline velocity is the one formula worth memorizing
Pipeline velocity combines four metrics into a single number that tells you how much revenue your pipeline generates per day. Think of it as the check engine light for your sales process.
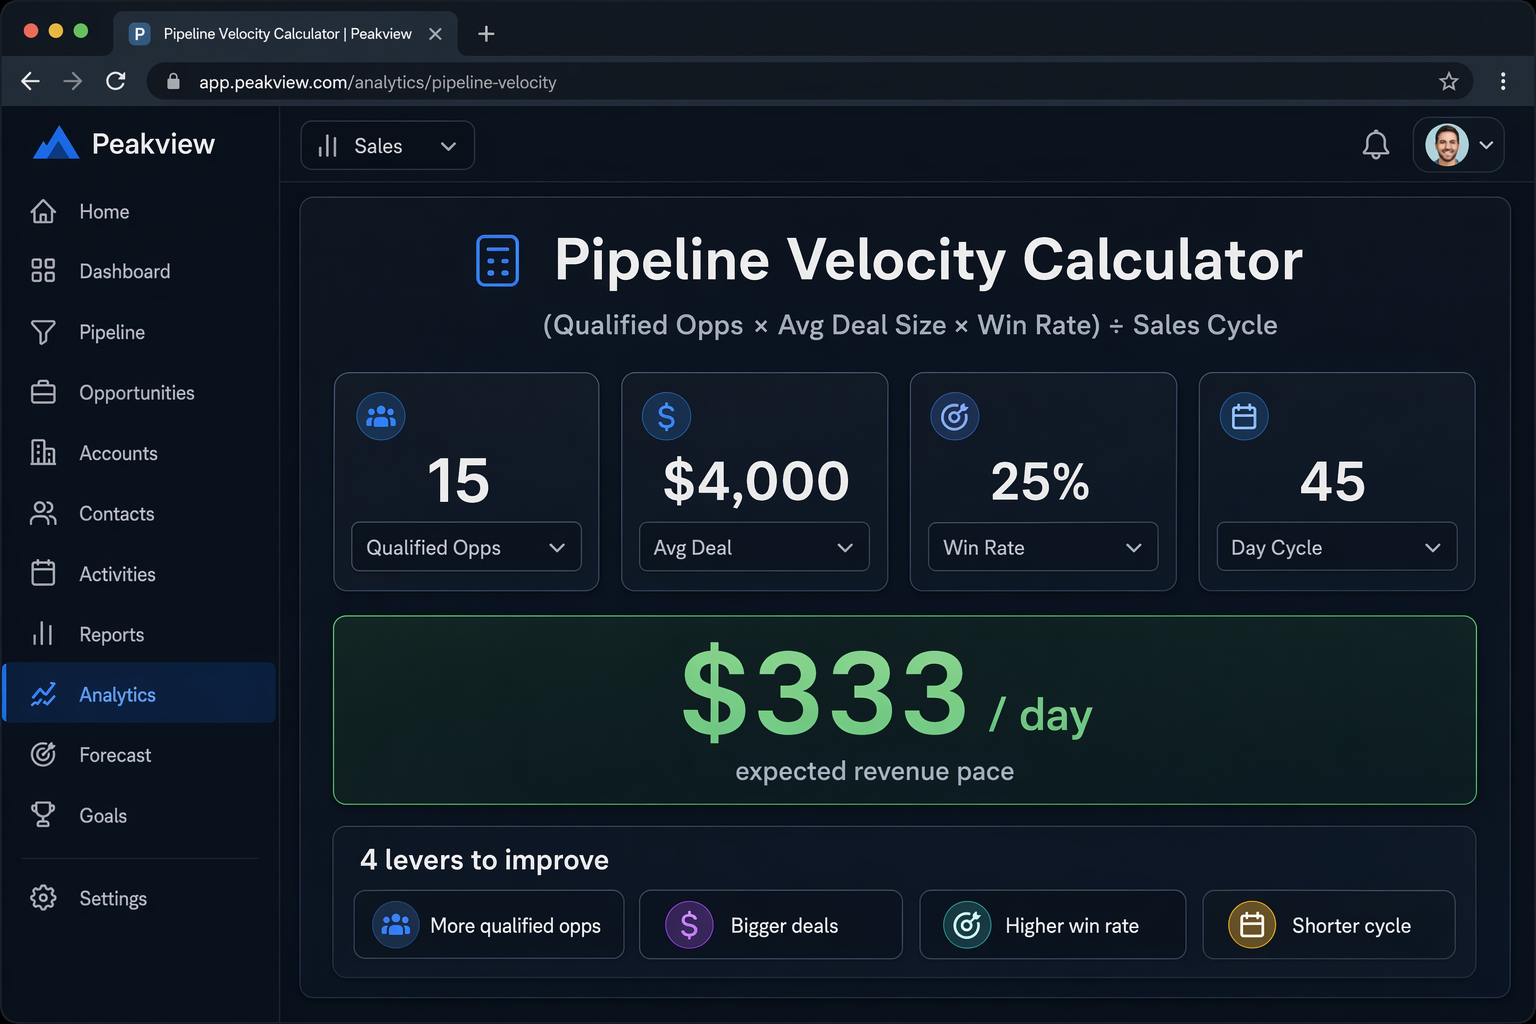
The formula: (Qualified Opportunities × Average Deal Size × Win Rate) ÷ Average Sales Cycle in Days.
Let's run a real example. Say you're a consultant with 15 qualified opportunities, a $4,000 average deal, a 25% win rate, and a 45-day sales cycle. Your velocity is (15 × $4,000 × 0.25) ÷ 45 = $333 per day. That's roughly $10,000 a month in expected revenue from your current pipeline.
The beauty of this formula is that it shows you exactly which lever to pull. Velocity too low? You've got four options: get more opportunities, increase deal size, improve win rate, or shorten the cycle. You don't have to fix everything — improving any single variable moves the whole number.
It also catches tradeoffs your gut might miss. If you raise prices but your sales cycle doubles because buyers take longer to decide, velocity might actually drop. Activity metrics would never surface that.
According to SPOTIO's sales data, 35–50% of sales go to the vendor that responds first. That means cycle length isn't just about your process — it's about speed relative to competitors. Pipeline velocity makes that visible.
Most small CRMs don't calculate velocity automatically. You'll need a simple spreadsheet or a custom field. Setup takes about 10 minutes, and you update it monthly. The effort-to-insight ratio is the best of any metric on this list.
If you only track one number from this article, make it velocity. Win rate, deal size, opportunity count, and cycle length are the ingredients. Velocity is the recipe.
How to set up CRM reporting in HubSpot, GoHighLevel, or Pipedrive
The five metrics above work in any CRM. Setup time and cost vary by platform. Here's where to start in the three we work with most.
Whichever platform you're on, the goal is the same: one screen with five numbers you check every Monday. No tabs, no drill-downs, no clicking through three menus. If getting to your key CRM reporting metrics takes more than 10 seconds, you won't check them — and a dashboard you don't look at is just wasted configuration.
If you're not sure which platform to pick, we've got a guide for choosing a CRM without overbuying. But whichever tool you're using, these five metrics work. The thinking behind the dashboard matters more than the software displaying it.
- HubSpot: Go to Reports → Dashboards and create a new dashboard. Add win rate, pipeline coverage, and deal velocity widgets. The catch: meaningful custom reporting requires HubSpot's Professional tier at $800/month. Starter gives you basic deal reports but won't let you build pipeline velocity calculations or custom formulas. If you're on Starter, track velocity in a spreadsheet and use HubSpot for win rate and pipeline value.
- GoHighLevel: Open your Opportunities section and review the pipeline view. GoHighLevel gives you deal counts, values, and stage breakdowns at every plan tier starting at $97/month with no per-user charges. The reporting is more basic than HubSpot's, but it covers pipeline value and close rates without a tier upgrade. For velocity, you'll want a separate spreadsheet — GHL doesn't have a built-in formula builder for custom metrics.
- Pipedrive: This is where Pipedrive earns its name. Go to Insights → Dashboards and add deal conversion, pipeline value, and activity widgets. Even the Lite plan at $14/user/month includes visual pipeline reporting and deal tracking. Pipedrive was built pipeline-first, so surfacing win rate and stage conversion is easier here than in most general-purpose CRMs. You'll still need a spreadsheet for the full velocity formula.
Check these numbers every Monday, not every quarter
CRM reporting is only useful if you actually look at it. The teams that get value from these metrics check them weekly — Monday morning, before the week's work starts.
Here's a 15-minute routine that works. Pull up your dashboard. Check the win rate trend — stable, climbing, or dropping? Look at pipeline coverage — above 3:1? Glance at velocity — has it moved since last week? If something's off, you've got five days to fix it before another week slips by.
- Is my win rate stable, climbing, or dropping?
- Is pipeline coverage above 3:1?
- Has velocity moved since last week?
- Are any deals stuck in the same stage for more than two weeks?
Five metrics beat fifty reports every time
Quarterly reviews are too late. By the time you spot a coverage gap in a quarterly report, the quarter is already lost. Weekly checks catch small problems before they compound. A win rate dipping two points this week is fixable. A win rate that's been falling for three months is a crisis.
If you've already audited your automations, add this dashboard check to the same cadence. Clean data, working automations, and honest reporting — that's the combination that turns a CRM from an expensive address book into something that actually predicts revenue.
The businesses we work with that hit their numbers consistently aren't using fancier software. They're checking five metrics every week, catching problems early, and adjusting before small dips become missed quarters.